Interactive visual management analytics

  • Compact dashboards instead of huge tables
  • For testing ideas and digital transformation of your business
  • On computers, tablets and smartphones
  • Business value as early as day 4 of the implementation
  • The whole project in 10 days
  • Price from $2,800
Order an implementation
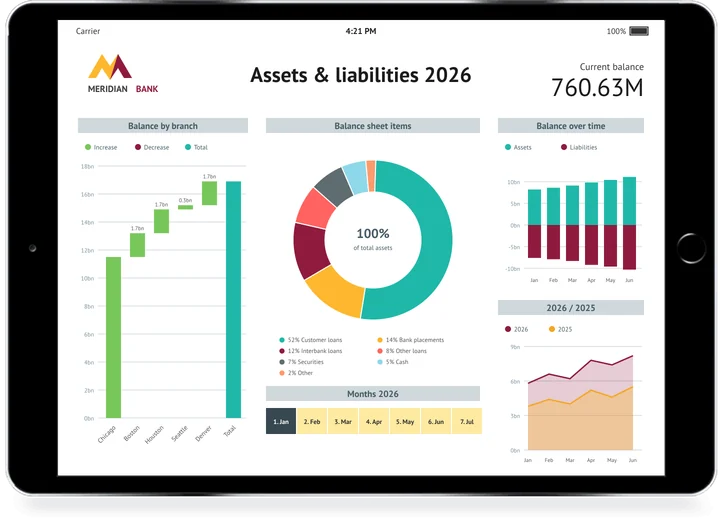
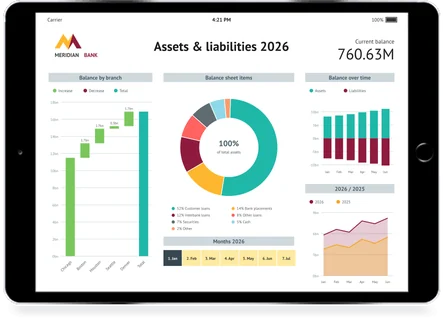
Management dashboard on a tablet: assets and liabilities, balance by branch

Solutions for your tasks

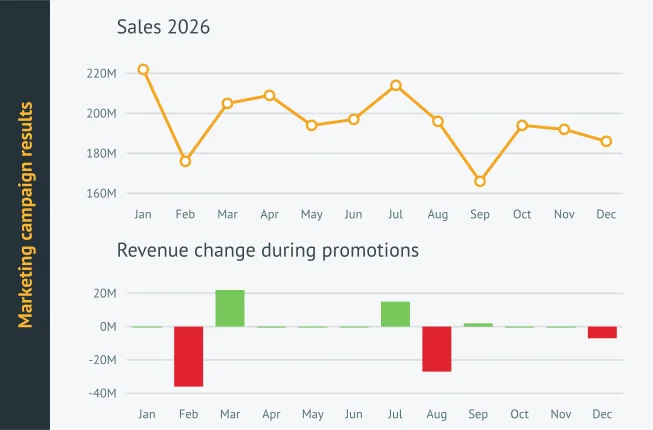
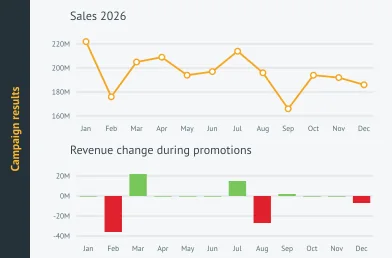
Marketing dashboard: sales line chart and revenue change during promotions

Marketing

For industries: retail, wholesale, manufacturing, logistics, banking
We provide multidimensional data on customer acquisition across sales channels and give you a convenient tool for working with the results of the analysis.
See a real example
  • Advertising channel effectiveness analysis
  • Marketing campaign effectiveness analysis
  • Consumer audience segmentation by sociodemographic or other attributes
  • Dashboard with custom KPIs
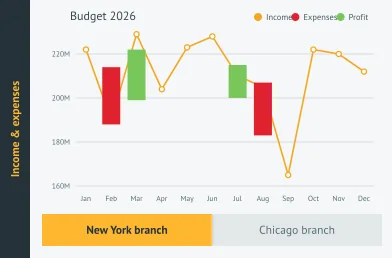
Finance dashboard: income and expenses budget by branch

Finance

For industries: retail, wholesale, manufacturing, logistics, banking
We present the cash flow statement, the income and expense report, and functional and master budgets in a clear visual form. We bring financial results and KPIs together in one place.
See a real example
  • Operational reports with drill-down into the data
  • Historical management P&L
  • Historical management cash flow statement
  • Historical management balance sheet
  • Historical departmental and functional budgets
  • Accounts receivable analysis
  • Accounts payable analysis
  • Dashboard with custom KPIs
  • Specific to banking
    • Analysis of financial instrument portfolios (loans, securities, cards, deposits and paid current accounts)
    • Payment calendar, liquidity gaps
    • Allocation of financial results to cost centres
    • Analysis of client data and credit history to identify financial needs, build personalised offers and minimise credit risk
    • Day-to-day loan portfolio management
    • Dashboard with custom KPIs
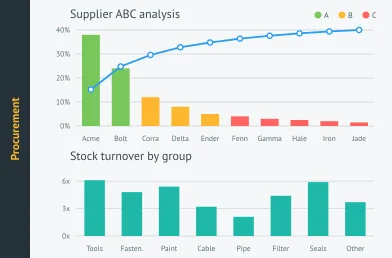
Procurement dashboard: supplier ABC analysis and stock turnover

Procurement

For industries: retail, wholesale, manufacturing
We provide data for plan-versus-actual purchasing analysis and comparison with previous periods by product, product group, warehouse, region and store, so you can forecast purchase volumes and find the causes of shortages and overstock.
See a real example
  • ABC analysis of suppliers
  • XYZ analysis of suppliers
  • Key product-matrix metrics (stock, turnover, sell-through rate)
  • Purchase volume forecast (by comparable periods with or without adjustment, or with more advanced models)
  • Analysis of delivery times by manufacturer or supplier
  • Analysis of shortage and overstock situations
  • Assortment classification to find product families (improves the accuracy of sales and forecast analytics)
  • Dashboard with custom KPIs
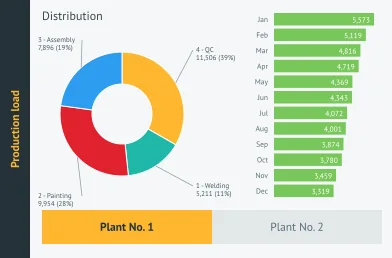
Production dashboard: load distribution by stage and monthly output

Production

For industries: manufacturing
We provide up-to-date information on production load and schedule, and on stock by product, product group, raw material and production site. We run plan-versus-actual analysis of production load.
See a real example
  • Gross-margin analysis of production lines, drilled down by product group, product and other analytical dimensions
  • Historical analysis (quantity, weight, length, price) of items, materials, components and finished goods, and how they compare
  • Analysis of production-process quality trends
  • Pipeline of production line load
  • Analysis of defects and write-offs
  • Dashboard with custom KPIs
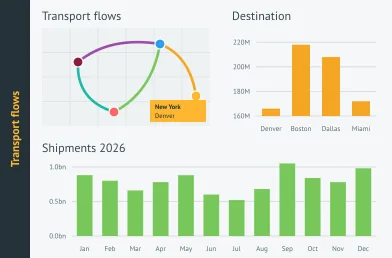
Logistics dashboard: transport flows, destinations and monthly shipments

Logistics

For industries: retail, wholesale, manufacturing, logistics
We provide multidimensional information on the flow of goods into, within and out of warehouses. Analytics are available by product, product group, warehouse and counterparty.
See a real example
  • Tracking of goods and shipments
  • Rational supply-chain management
  • Detailed logistics cost accounting (transport, warehousing and other costs)
  • Inventory analysis and monitoring
  • Analysis of written-off materials and goods
  • Analysis of raw-material storage conditions and equipment needs
  • Analysis of claims handling with suppliers
  • Dashboard with custom KPIs
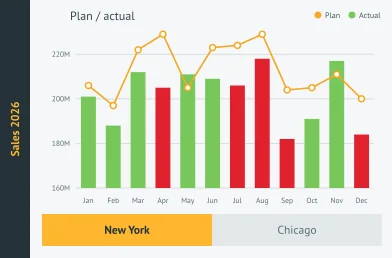
Sales dashboard: plan versus actual by month

Sales

For industries: retail, wholesale, manufacturing, logistics, banking
Multidimensional sales analysis by product, product group, region and store. Sales profitability analysis, plan-versus-actual analysis and comparison with previous periods. For wholesale and manufacturers we visualise the sales funnel from CRM data, enriched with extra dimensions such as managers and regions.
See a real example
  • Sales dynamics by product, group, region and store
  • Plan-versus-actual analysis with period-over-period comparison
  • Sales profitability and margin analysis
  • Sales funnel built from CRM data
  • Sales manager performance and quotas
  • Customer segmentation and repeat-purchase analysis
  • Forecast of sales volumes
  • Dashboard with custom KPIs

Run your business the way you like

The key performance indicators of your business live on monitoring dashboards
and are available from any device

No more waiting, no more doubts about your data.

Up-to-date numbers are available on your laptop, tablet or smartphone whenever you want them,
wherever you are.
Try it on a smartphone or tablet
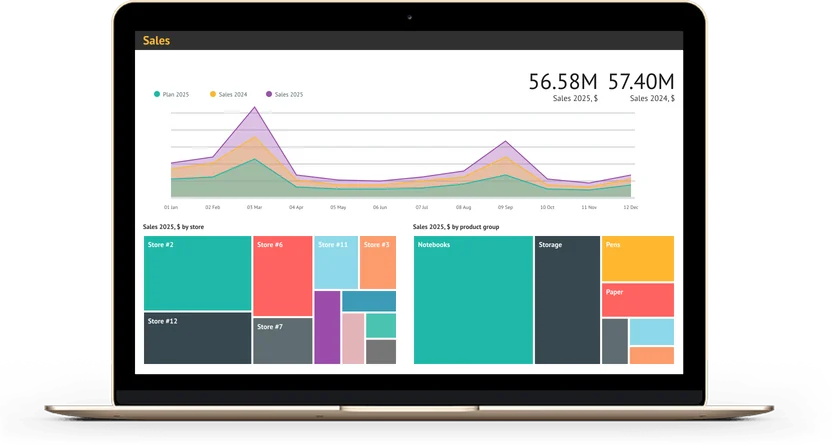
Sales dashboard on a laptop
The same dashboard on a tablet
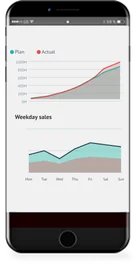
Sales charts on a smartphone

New possibilities of interactive visual analytics

A single source of truth

Up-to-date, reliable information from all your accounting systems in one analytics tool

Your report is ready anytime, anywhere

The report is always available on a laptop, tablet or smartphone from any place in the world
Marketing campaign results: sales and revenue change during promotions
10 min
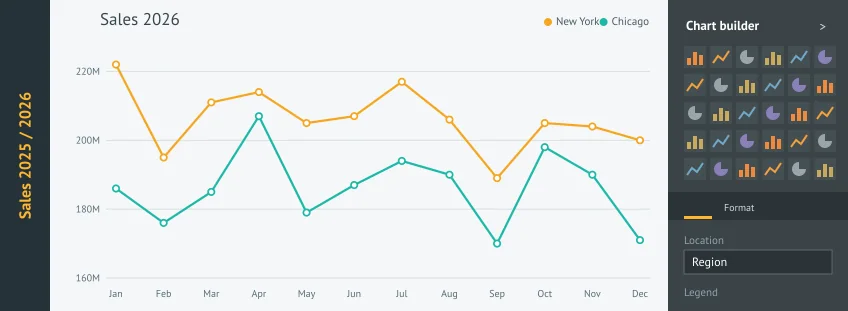
Chart builder with chart types and a sales line chart for two regions

Analytics without analysts

Edit reports and build new ones yourself in minutes

Fast implementation

  • Business value as early as day 4 of the implementation
  • 4 dashboards in 10 days
  • Price from $2,800

Do you need a personalised solution?

We identify problems and propose solutions

We interview the key people in your company. We identify the metrics and problems that matter most to the business.

We propose solutions for monitoring and analysing these metrics and define the analytical cases that need to be implemented.

Estimate the project cost
Illustration of documents with an idea marker

We connect data sources in a visual interface

We connect your accounting systems, CRM, spreadsheets and databases in a visual interface, with no manual exports.

Data is refreshed automatically on the schedule you choose.
Estimate the project cost
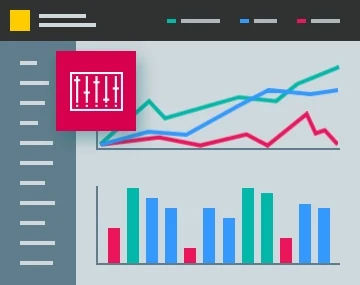
Illustration of a dashboard with a settings marker

Together with you we build interactive monitoring dashboards

We work in short iterations: every few days you see a working dashboard and tell us what to change.

Together we define the KPIs, drill-downs and filters your managers actually use.
Estimate the project cost
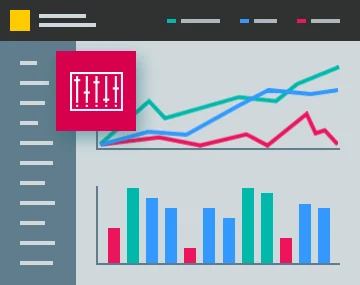
Illustration of a dashboard with a sliders marker

We train your staff to work independently

We run hands-on workshops for analysts and managers. Your team learns to change reports and build new ones on its own.

We hand over documentation for your IT service.

Estimate the project cost
Illustration of two people and a checklist

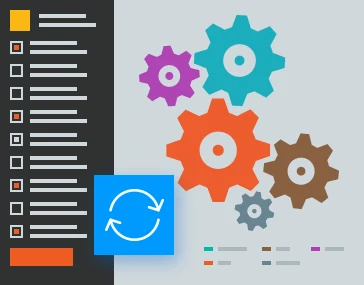
We keep developing your analytics system with you

After launch we track how the dashboards are used and which questions are still unanswered.

We add new data sources and analytical cases as your business grows.
Estimate the project cost
Illustration of gears and a refresh marker

Already using our solution

Request a reference call

Order an implementation in 10 days

Focus on finding solutions instead of searching for data!

I agree to the privacy policy